Troubleshooting client issues
This document offers practical tips and insights to help you debug various problems, ensuring a seamless user experience.
openZro agent status
The openzro agent is a daemon service that runs in the background; it provides information about peers connected and about the openZro control services. You can check the status of the agent with the following command:
openzro status --detail
This will output the following information:
Peers detail:
 server-a.openzro.cloud:
  openZro IP: 100.75.232.118/32
  Public key: kndklnsakldvnsld+XeRF4CLr/lcNF+DSdkd/t0nZHDqmE=
  Status: Connected
  -- detail --
  Connection type: P2P
  Direct: true
  ICE candidate (Local/Remote): host/host
  ICE candidate endpoints (Local/Remote): 10.128.0.35:51820/10.128.0.54:51820
  Last connection update: 20 seconds ago
  Last Wireguard handshake: 19 seconds ago
  Transfer status (received/sent) 6.1 KiB/20.6 KiB
  Quantum resistance: false
  Routes: 10.0.0.0/24
  Latency: 37.503682ms

 server-b.openzro.cloud:
  openZro IP: 100.75.226.48/32
  Public key: Mi6jtrK5Tokndklnsakldvnsld+XeRF4CLr/lcNF+DSdkd=
  Status: Connected
  -- detail --
  Connection type: Relayed
  Direct: false
  ICE candidate (Local/Remote): relay/host
  ICE candidate endpoints (Local/Remote): 108.54.10.33:60434/10.128.0.12:51820
  Last connection update: 20 seconds ago
  Last Wireguard handshake: 18 seconds ago
  Transfer status (received/sent) 6.1 KiB/20.6 KiB
  Quantum resistance: false
  Routes: -
  Latency: 37.503682ms

OS: darwin/amd64
Daemon version: 0.27.4
CLI version: 0.27.4
Management: Connected to https://api.openzro.io:443
Signal: Connected to https://signal.openzro.io:443
Relays:
  [stun:turn.openzro.io:5555] is Available
  [turns:turn.openzro.io:443?transport=tcp] is Available
Nameservers:
  [8.8.8.8:53, 8.8.4.4:53] for [.] is Available
FQDN: maycons-mbp-2.openzro.cloud
openZro IP: 100.75.143.239/16
Interface type: Kernel
Quantum resistance: false
Routes: -
Peers count: 2/2 Connected
As you can see, the output shows the peers connected, the openZro IP address, the public key, the connection status, and the connection type. The status will also report if there is an issue connecting to the relay servers, the management server, or the signal server.
As for Peers, the status will show the following information:
Connection type: P2P, Relayed, where relayed connections indicate a limitation in the network that prevents a direct connection between the peers.Direct: true/false, where true indicates a direct connection between the peers without a local proxy. This case is common when the local peer is allocating the relay connection.ICE candidate (Local/Remote): relay/host, where relay indicates that the local peer is using a relay connection and host indicates that the remote peer is using a direct connection.Last Wireguard handshake: Indicating the last time the Wireguard handshake was performed. Usually, this is performed every 2 minutes, and if you don't see an update here or if the value is empty, that indicates that the connection wasn't possible yet.Transfer status (received/sent): Indicating the amount of data received and sent by the peer. This is useful to check if the connection is being used.
See more details about the status command here.
Getting client logs
By default, client logs are located in the /var/log/openzro/client.log file on macOS and Linux and in the
C:\ProgramData\openzro\client.log file on Windows.
You can analyze the logs to identify the root cause of the problem. If you need help, open a github issue and attach the logs.
Debug bundle
A debug archive containing the recent logs and the status at the time of execution can be generated with the following command.
Adding the --anonymize (-A) flag will anonymize the logs, removing sensitive information such as public IP addresses
and domain
names. In case you have tunneling issues, omitting the --anonymize flag might help our analysis.
Adding the --system-info (-S) flag will add system information like network routes and interfaces
openzro debug bundle --anonymize --system-info
This will output the path of the generated file. The output file is owned by and can only be accessed by the user
openZro is running as, by default it is: Administrator on Windows, root on MacOS/Linux or the operating system's
equivalent.
Debug for a specific time
To capture logs for a specific time period, you can use the debug for command. This will generate a debug bundle after
the specified time has elapsed.
openzro debug for 5m --system-info
The flag --anonymize (-A) can be used to anonymize IP addresses and non-openzro.io domains in logs and status output when needed.
To capture any issues arising during the up and down processes, this will set the log level to TRACE and bring
openzro up and down up to a few times.
After 5 minutes the openzro status will be restored to the previous state and the debug bundle will be generated.
Debug bundle uploads
Since version 0.43.1, you can share debug bundle with the openZro development team without local administrative
privileges
by using the --upload-bundle (-U) flag.
It will securely generate and upload the debug bundle to our servers for access by the openZro development team. See
examples below:
Run debug for a specific time and upload the bundle:
openzro debug for 1m --system-info --upload-bundle
To generate a bundle without restarting the client and then uploading:
openzro debug bundle --system-info --upload-bundle
This will output an Upload file key, which is effectively a random filename in our internal storage system
and can be safely shared with us through public channels such as GitHub Issues or Slack.
openzro debug bundle --system-info --upload-bundle
Local file:
/tmp/openzro.debug.2611377582.zip
Upload file key:
1234567890ab27fb37c88b3b4be7011e22aa2e5ca6f38ffa9c4481884941f726/12345678-90ab-cdef-1234-567890abcdef
The flag --anonymize can be used to anonymize IP addresses and non-openzro.io domains in logs and status output when needed.
Debug bundle uploads with GUI
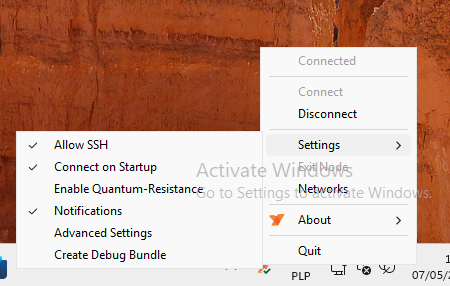
Since version 0.43.2 users can upload their debug bundle via the GUI client.
To generate a bundle via GUI, you can access the application then go to Settings > Create Debug Bundle and follow
the wizard to upload the bundle:
If needed, you can update the upload URL and select to anonymize sensitive information like IP addresses and non-openzro.io domains in logs and status output.
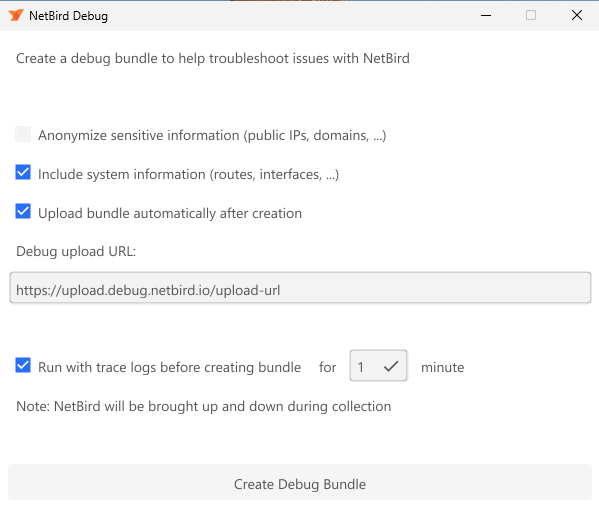
By default running with trace log enable before generating the bundle is selected. This will restart the client connections and provide a disconnect to connected information for our engineers.
If you uncheck this option, a bundle will be generated without running this step. Which is very useful when you have an issue that recovers when restarting the client.
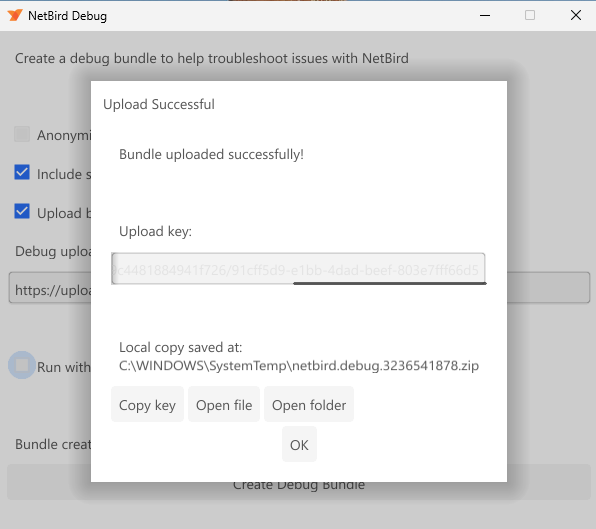
Once the bundle generation is complete, you can click on Copy Key to get the uploaded key and share with openZro's team.
Remote debug bundle generation
Administrators can remotely request debug bundles from peer clients through the Management API or Dashboard. For a complete overview of remote job capabilities, permissions, and configuration, see the Remote Jobs documentation.
This is particularly useful when troubleshooting issues on remote machines where local access is limited or when working with end-users who may not be familiar with command-line tools.
When a remote debug bundle is requested:
- The management server sends a job request to the target peer
- The peer client receives the job and generates the debug bundle automatically
- The generated bundle is uploaded to a centralized location
- The administrator receives the upload key to access the bundle
Using the Management API
You can also trigger remote debug bundles programmatically via the Management API.
See the Peers API documentation for complete API reference, including:
- Creating debug bundle jobs
- Listing all jobs for a peer
- Getting job status and upload keys
Using the Dashboard
You can trigger remote debug bundles directly from the openZro Dashboard without requiring CLI access.
To generate a remote debug bundle:
- Navigate to Peers in the dashboard
- Click on the peer you want to troubleshoot
- Click the Run Remote Job button (the peer must be online and connected)
- Select Debug Bundle from the dropdown menu
- Configure the debug bundle options:
- Log File Count: Number of log files to include (1-50, default: 10)
- Enable Bundle Duration (optional): Collect logs for a specific time period (1-5 minutes) before generating the bundle
- Anonymize Log Data: Remove sensitive information like IP addresses and domains
- Click Create Debug Bundle
Viewing job status and results:
Once triggered, the job appears in the Remote Jobs section on the peer details page. The table shows:
- Type: The job type (Debug Bundle)
- Status: Pending (yellow), Completed (green), or Failed (red)
- Created/Updated: Timestamps for job lifecycle
- Output: Once completed, displays the upload key that you can copy and share with openZro support
The upload key is automatically copyable by clicking on it. Share this key through GitHub Issues, Slack, or support channels.
Limitations
- The peer must be online and connected to the management server to receive the job
- Debug bundle generation may take a few seconds to a few minutes depending on log size and system information
- Bundles are automatically uploaded to openZro's secure storage (or your configured upload endpoint for self-hosted deployments)
- Upload keys expire after 30 days for security
Tracing firewall rules
If a connection is being blocked and you suspect a policy issue, the debug trace command lets you simulate a packet through the firewall rules without sending real traffic. See the CLI reference for full usage and examples.
openzro debug trace in 100.64.1.1 self -p tcp --dport 80
On Linux, the userspace packet filter is only active when the kernel firewall backend (nftables/iptables) is not available. debug trace is primarily useful on macOS and Windows.
Advanced environment variables
The client has environment variables for tuning routing, firewall behavior, ICE connectivity, and WireGuard mode. These can help work around edge cases (e.g. NB_USE_LEGACY_ROUTING for routing loop issues, NB_WG_KERNEL_DISABLED to force userspace WireGuard, NB_SKIP_NFTABLES_CHECK to fall back to iptables). See the full list at Client Environment Variables.
Enabling debug logs on agent
Logs can be temporarily set using the following command.
openzro debug log level debug
or
openzro debug log level trace
The next time the daemon is restarted, the log level will return to the configured level.
Using openzro down and openzro up will not reset the log level.
To permanently set the log level, see the following sections.
The default logging level is info. To revert back to the original state, you can repeat the procedure with info instead of debug or trace.
On Linux with systemd
The default systemd unit file reads a set of environment variables from the path /etc/sysconfig/openzro.
You can add the following line to the file to enable debug logs:
sudo mkdir -p /etc/sysconfig
echo 'NB_LOG_LEVEL=debug' | sudo tee -a /etc/sysconfig/openzro
sudo systemctl restart openzro
On Other Linux and MacOS
sudo openzro service stop
sudo openzro service uninstall
sudo openzro service install --log-level debug # or trace
sudo openzro service start
On Windows
You need to run the following commands with an elevated PowerShell or cmd.exe window.
[Environment]::SetEnvironmentVariable("NB_LOG_LEVEL", "debug", "Machine")
openzro service restart
On Docker
You can set the environment variable NB_LOG_LEVEL to debug to enable debug logs.
docker run --rm --name PEER_NAME --hostname PEER_NAME --cap-add=NET_ADMIN --cap-add=SYS_ADMIN --cap-add=SYS_RESOURCE -d \
-e NB_SETUP_KEY=<SETUP KEY> -e NB_LOG_LEVEL=debug -v openzro-client:/var/lib/openzro openzro/openzro:latest
On Android
Enable the ADB in the developer menu on the Android device. In the app set the the Trace log level setting - it is a checkbox in the advanced menu. With the ADB tool, you can get the logs from your device. The ADB is part of the SDK platform tools pack (zip file). You can download it from here. Please extract it and run the next command in the case of Linux:
sudo adb logcat -v time | grep GoLog
Running the agent in foreground mode
You can run the agent in foreground mode to see the logs in the terminal. This is useful to debugging issues with the agent.
Linux and MacOS
sudo openzro service stop
sudo openzro up -F
Windows
On Windows, the agent depends on the Wireguard's wintun.dll and can only be executed as a system account.
To run the agent in foreground mode, you need to use a tool
called PSExec.
Once you have downloaded and extracted psexec open an elevated Powershell window:
openzro service stop
.\PsExec64.exe -s cmd.exe /c "openzro up -F --log-level debug > c:\windows\temp\openzro.out.log 2>&1"
In case you need to configure environment variables, you need to add them as system variables so they get picked up by the agent on the next psexec run:
[Environment]::SetEnvironmentVariable("PIONS_LOG_DEBUG", "all", "Machine")
Enabling WireGuard in user space
Sometimes, you want to test openZro running on userspace mode instead of a kernel module. That can be a check to see if there is a problem with openZro's firewall management in kernel mode.
You must run the agent in foreground mode and set the environment variable NB_WG_KERNEL_DISABLED to true.
sudo openzro service stop
sudo bash -c 'NB_WG_KERNEL_DISABLED=true openzro up -F'  > /tmp/openzro.log
Debugging GRPC
The openZro agent communicates with the Management and Signal servers using the GRPC framework. With these parameters, you can set verbose logging for this service.
sudo openzro service stop
sudo bash -c 'GRPC_GO_LOG_VERBOSITY_LEVEL=99 GRPC_GO_LOG_SEVERITY_LEVEL=info openzro up -F' > /tmp/openzro.log
Debugging ICE connections
The openZro agent communicates with other peers through the Interactive Connectivity Establishment (ICE) protocol
described in the RFC 8445. To debug the connection procedure,
set verbose logging for the the Pion/ICE library with the PIONS_LOG_DEBUG or
PIONS_LOG_TRACE variable.
Environment variable
PIONS_LOG_DEBUG=all
NB_LOG_LEVEL=debug
sudo openzro service stop
sudo bash -c 'PIONS_LOG_DEBUG=all NB_LOG_LEVEL=debug openzro up -F' > /tmp/openzro.log
Host-based firewall issues
openZro automatically adds firewall rules on all platforms to allow traffic on the openZro interface (wt0).
However, conflicts can occur with other firewall management tools or security software.
Symptoms
- Peers show as "Connected" in
openzro statusbut cannot ping or reach each other - Connection works on some machines but not others with the same network configuration
- Connection works after disabling the host firewall but fails when re-enabled
- P2P connections work but routed traffic does not
Understanding the issue
openZro manages firewall rules directly via iptables/nftables (Linux/macOS) or Windows Firewall APIs. When another tool also manages firewall rules, conflicts can occur:
| Tool | Conflict Type |
|---|---|
| UFW (Linux) | Chain ordering - UFW may evaluate its deny rules before openZro's allow rules |
| firewalld (Linux) | Zone conflicts - openZro interface may be in wrong zone |
| Windows Group Policy | Policy may override or remove openZro's firewall rule |
| Third-party security software | May block traffic independently of OS firewall |
UFW (Linux)
UFW is a frontend for iptables commonly used on Ubuntu. Its default policy denies all incoming traffic, which can block openZro traffic before it reaches openZro's iptables rules.
Check UFW status:
sudo ufw status verbose
If UFW is active with a default deny incoming policy, add a rule for the openZro interface:
Allow openZro interface:
sudo ufw allow in on wt0
Verify the rule was added:
sudo ufw status | grep wt0
Expected output:
Anywhere on wt0             ALLOW       Anywhere
Anywhere (v6) on wt0        ALLOW       Anywhere (v6)
Alternative - Allow specific openZro subnet:
If you prefer a more restrictive rule:
sudo ufw allow in on wt0 from 100.64.0.0/10
firewalld (Linux)
On distributions using firewalld (RHEL, CentOS, Fedora), ensure the wt0 interface is in a trusted zone:
Check current zone for wt0:
sudo firewall-cmd --get-zone-of-interface=wt0
Add wt0 to trusted zone:
sudo firewall-cmd --permanent --zone=trusted --add-interface=wt0
sudo firewall-cmd --reload
Windows Firewall
openZro creates a Windows Firewall rule automatically that allows traffic on the openZro IP address
(the wt0 interface). This covers traffic after WireGuard decryption.
Check if the openZro rule exists:
Get-NetFirewallRule | Where-Object { $_.DisplayName -like "*openZro*" } | Format-List DisplayName, Enabled, Direction, Action
Check if the rule is being applied:
Get-NetFirewallRule | Where-Object { $_.DisplayName -like "*openZro*" } | Get-NetFirewallAddressFilter
Manually create the rule if missing:
New-NetFirewallRule -DisplayName "openZro" -Direction Inbound -InterfaceAlias "wt0" -Action Allow
Check for Group Policy overrides:
If the rule exists but traffic is still blocked, Group Policy may be overriding local firewall rules. Check with your IT administrator or review:
Get-NetFirewallProfile | Format-List Name, Enabled, DefaultInboundAction
Environments without NAT (flat networks, routed VLANs)
In most environments, NAT provides stateful connection tracking. When Peer A sends UDP to Peer B, the return traffic is allowed because the NAT device tracks it as part of an established connection.
However, in environments without NAT between peers (e.g., flat office networks, routed VLANs without masquerading), Windows Firewall may block incoming WireGuard P2P traffic because:
- There is no NAT state tracking the "connection"
- Windows Firewall sees the incoming UDP packets as unsolicited inbound traffic
- The default openZro rule only covers traffic on the
wt0interface (after decryption), not the raw WireGuard packets arriving on the physical interface
Symptoms:
- P2P works when one peer is behind NAT but fails when both peers are on the same flat network
openzro status -dshows connection type as "Relayed" instead of "P2P" for local peers- P2P works after disabling Windows Firewall
Solution: Add a firewall rule to allow inbound UDP for WireGuard P2P traffic, scoped to the openZro process:
New-NetFirewallRule -DisplayName "openZro P2P" -Direction Inbound -Action Allow -Protocol UDP -LocalPort 49152-65535 -Program "C:\Program Files\openZro\openzro.exe"
This rule:
- Allows inbound UDP on the ephemeral port range (used for WireGuard)
- Is scoped to only the openZro process for security
- Does not expose any other services
Note: This is only needed in environments without NAT between peers. If your peers connect through NAT (typical for remote access scenarios), the default rules are sufficient.
Linux in non-NAT environments: The same principle applies. If UFW or firewalld is blocking inbound UDP on the physical interface, you may need to allow it. However, Linux cannot scope firewall rules to a specific process like Windows can. A broader rule would be required:
# UFW - allows inbound UDP on ephemeral ports (less restrictive than Windows equivalent)
sudo ufw allow in proto udp to any port 49152:65535
Consider whether this is acceptable for your security posture, or use openZro's relay fallback instead.
Third-party security software
Antivirus and endpoint protection software often includes its own firewall that operates independently of the OS firewall. Common culprits include:
- Symantec Endpoint Protection
- McAfee
- Kaspersky
- ESET
- CrowdStrike Falcon
If you suspect third-party software is blocking openZro:
- Temporarily disable the third-party firewall component (not the entire product)
- Test openZro connectivity
- If it works, add an exception for the openZro process or the
wt0interface
The openZro process locations:
- Windows:
C:\Program Files\openZro\openzro.exe - Linux:
/usr/bin/openzro - macOS:
/usr/local/bin/openzro
Collecting firewall diagnostics
When reporting firewall-related issues, include a debug bundle with system information:
openzro debug bundle --system-info
The --system-info flag captures:
- Network routes
- Interface configuration
- Firewall rules (where accessible)
Additional diagnostics for Linux:
# Current iptables rules
sudo iptables -L -n -v

# nftables rules (if applicable)
sudo nft list ruleset

# UFW status
sudo ufw status verbose
Additional diagnostics for Windows (run as Administrator):
# All firewall rules for wt0
Get-NetFirewallRule | Where-Object { $_.DisplayName -like "*openZro*" -or $_.DisplayName -like "*wt0*" }

# Firewall profile status
Get-NetFirewallProfile
Quick reference
| Platform | Check Command | Fix Command |
|---|---|---|
| UFW (Linux) | sudo ufw status | sudo ufw allow in on wt0 |
| firewalld (Linux) | sudo firewall-cmd --get-zone-of-interface=wt0 | sudo firewall-cmd --permanent --zone=trusted --add-interface=wt0 && sudo firewall-cmd --reload |
| Windows | Get-NetFirewallRule | Where-Object { $_.DisplayName -like "*openZro*" } | Check Group Policy or third-party software |
| Windows (no NAT) | P2P shows as Relayed for local peers | New-NetFirewallRule -DisplayName "openZro P2P" -Direction Inbound -Action Allow -Protocol UDP -LocalPort 49152-65535 -Program "C:\Program Files\openZro\openzro.exe" |
Client login failures
A single machine can only connect to one openZro account as the same user/login method throughout the lifetime of
the config.json file:
/var/lib/openzro/default.jsonfor Linux/MacOSC:\ProgramData\openzro\default.jsonfor Windows
You might get errors like below when trying to use Setup Key/different SSO user account during login:
2025-04-08T15:03:04+01:00 ERRO management/client/grpc.go:351: failed to login to Management Service: rpc error: code = PermissionDenied desc = peer login has expired, please log in once more
2025-04-08T15:03:04+01:00 ERRO management/client/grpc.go:351: failed to login to Management Service: rpc error: code = PermissionDenied desc = invalid user
2025-04-08T15:03:04+01:00 ERRO client/internal/login.go:145: failed registering peer rpc error: code = PermissionDenied desc = invalid user,00000000-0000-0000-0000-000000000000
2025-04-08T15:03:04+01:00 WARN client/server/server.go:267: failed login: rpc error: code = PermissionDenied desc = invalid user
Starting with the release 0.50.0 the invalid user message is more descriptive:
peer is already registered by a different User or a Setup Key
The most notable examples of encountering the issue are:
- a shared machine and/or machine previously logged in by somebody else,
- a machine that was previously logged in using Setup Key, but now attempts SSO login,
- the user makes a mistake and selects
- the user uses different browser/profile or selects the wrong account during SSO login at the start of the workday,
If you know the exact previous Peer which was logged in, you can just delete it from Dashboard without doing anything else and attempt login again.
Otherwise, to resolve the issue, you will need to remove the file manually to use the machine as a different user/Setup Key while the openZro client daemon is stopped:
openzro service stopsudo rm /var/lib/openzro/default.json(*nix) orrm C:\ProgramData\openzro\config.json(Windows)openzro service start
Debugging access to network resources
In this section we will be presenting methodology of troubleshooting access issues involving openZro.
We will start by presenting a glossary of all machines and services involved. A sub-section will describe a specific use case. Each will start with a concise summary of usual troubleshooting steps then expand into more detailed step-by-step guides.
Glossary
We will be using the following names for resources outside the openZro network:
int-net1: an internal network10.123.45.0/24,srv-c: an internal HTTP server running at10.123.45.17,int-dns1: an internal DNS server running at10.123.45.6,int-dns2: an internal DNS server nunning at10.7.8.9,cf-dns: an Internet-accessible CloudFlare DNS server at1.1.1.1and1.0.0.1,
and following openZro network resources:
peer-a: end user's device running openZro Client,peer-b: a linux server inside the internal network running openZro Client,- it has direct access to the whole
int-net1IP range,
- it has direct access to the whole
users:employees: a openZro Group containingpeer-a,routers:int-net1: a openZro Group containingpeer-b,access:srv-c: a openZro Groups used as a target of ACL rules forsrv-conly,access:int-net1: a openZro Groups used as a target of ACL rules for the whole subnet,net-a: a openZro Networknet-a:srv-c: a Network Resource handling traffic to10.123.45.17/32(srv-c),net-a:int-net1: a Network Resource handling traffic to10.123.45.0/24(int-net1),
route:int-net1: a openZro Network Route handling traffic to10.123.45.0/24(int-net1),route:srv-c: a openZro Network Route handling traffic to10.123.45.17/32(srv-c),
Access from peer-a to srv-c
peer-a to srv-cIn short:
- Does
peer-bhave direct access tosrv-c's port80? - Can a routing peer
peer-bforward traffic tosrv-c? - Are openZro's network routing resources configured?
- Do openZro's Access Control rules allow access from
peer-ato the target's ACL Group? - Is
peer-a's operating system configured to use the route?
Access Control rule is not required for connectivity from peer-a to peer-b
Does peer-b have direct access to srv-c's port 80?
peer-b have direct access to srv-c's port 80?After logging in to peer-b you can confirm/troubleshoot the HTTP port 80 connection by issuing any of the following
commands:
curl -v "http://10.123.45.17"
curl --fail -v --max-time=2 "http://10.123.45.17:80"
wget -O - --timeout=2 "http://10.123.45.17:80"
nc -nvz -w 2 10.123.45.17 80
You can also try ping (an ICMP packet), but the firewall might have a different configuration for ICMP and TCP ports:
ping --numeric --count=1 --timeout=2 10.123.45.17
Can a routing peer peer-b forward traffic to srv-c?
peer-b forward traffic to srv-c?This is more complicated to test, but usually boils down to confirming net.ipv4.ip_forward is set to 1 on peer-b's
Linux operating system:
> sysctl net.ipv4.ip_forward
net.ipv4.ip_forward = 1
It should be set up automatically by the openZro client unless it runs inside a container (which would not be able
to modify sysctl), then it requires manual setup.
For setting up the value persistently (across reboots) please consult your operating system's documentation.
It is often handled by either /etc/sysctl.conf or /etc/sysctl.d/*.conf files.
Testing the functionality in practice involves:
- connecting to another machine with direct access to
peer-b, - adding a routing table entry to route
int-net1(10.123.45.0/24) traffic through it, - trying to at least
ping 10.123.45.17(srv-c)
Are openZro's network routing resources configured?
For openZro network routing resources configurations you can use either (new) Networks or (old) Network Routes.
A Network net-a should have at minimum:
- Network Resource:
net-a:srv-cwith either of:- an Address set to
10.123.45.17/32to configure route tosrv-cexclusively and nothing else, - Assigned Groups set to
access:srv-c
- an Address set to
- Routing Peer Group assigned to
routers:int-net1
A Network Route route:srv-c should have at least:
- a Network Range set to
10.123.45.17/32to configure route tosrv-cexclusively and nothing else, - Routing Peer Group assigned to
routers:int-net1, - Distribution Group assigned to
users:employees, - (optional) Access Control Groups assigned to
access:srv-c,
You can loosen the rules and replace following to grant access to the whole int-net1 network range:
- Address:
10.123.45.17/32->10.123.45.0/24, - Assigned Groups / Access Control Groups:
access:srv-c->access:int-net1
Do openZro's Access Control rules allow access from peer-a to the target's ACL Group?
peer-a to the target's ACL Group?You can skip this check, when you are using (old) Network Route feature without filling in Access Control Groups ( optional) section.
Otherwise, there should be an Access Control Policy present allowing traffic from one of peer-a's Groups to:
- Networks Resource's Assigned Groups:
access:srv-coraccess:int-net1, - Network Route's Access Control Groups:
access:srv-coraccess:int-net1,
You can confirm the Policy is working by:
- logging in to
peer-a, - issuing
openzro status -dcommand, - finding
peer-b.openzro.cloudunderPeers detail, - finding
10.123.45.0/24or10.123.45.17/32underpeer-b.openzro.cloud's Networks field,
In the most specific setup it should have at:
- have
TCPprotocol selected, - a blue arrow should point from left to right and a second right-to-left arrow should be greyed out,
- a Source group set to
users:employees, - a Destination group set to
access:srv-c, - have
80in the Ports section,
Just like with the previous section you can loosen the above example by:
- replacing
access:srv-cGroup withaccess:int-net1Group, - allowing
ALLprotocol, Ports will become greyed out because all traffic will be allowed, - creating a bidirectional rule (both arrows should be green), always true for the protocol
ALL, - selecting a different source group from the pool assigned to
peer-a,- it could be built-in
Allgroup, but it is discouraged,
- it could be built-in
- selecting a different destination group from the pool assigned to
peer-b,- it could be built-in
Allgroup, but it is discouraged,
- it could be built-in
Is peer-a's operating system configured to use the route?
peer-a's operating system configured to use the route?After all resources are configured in the openZro management you should check whether they are properly registered with your operating system.
You can start by checking openZro client's configuration with openzro status -d command:
% openzro status -d
Peers detail:
 brys-vm-nbt-ubuntu-isolated-01.openzro.cloud:
...
  Status: Connected
  -- detail --
  Connection type: P2P
...
  Networks: 10.123.45.0/24
...
Peers count: 1/1 Connected
You should be primarily looking for Networks section under each Peers detail, but you can also check:
- Peer's name,
- Peer's Status: it should be
Connected, - Peer's Connection type: it can be either
P2P(direct) orRelayed(over the Internet), - Peers count near the end of the output,
If it's missing you can search for clues with openzro networks ls command:
% openzro networks ls
Available Networks:
...
  - ID: net-a:int-net1
    Network: 10.123.45.0/24
    Status: Selected
...
The Status could be Not Selected, which you can fix with openzro networks select <ID> or
openzro networks select all
Verifying routing configuration on the Windows operating system
Below commands assume running a PowerShell prompt with administrator's privileges.
The easiest way is to read output of Get-NetRoute command:
PS C:\Users\user> Get-NetRoute

ifIndex DestinationPrefix                              NextHop                                  RouteMetric ifMetric PolicyStore
------- -----------------                              -------                                  ----------- -------- -----------
...
17      10.123.45.255/32                             0.0.0.0                                          256 5        ActiveStore
17      10.123.45.0/24                               0.0.0.0                                            1 5        ActiveStore
...
17      100.83.255.255/32                              0.0.0.0                                          256 5        ActiveStore
17      100.83.183.133/32                              0.0.0.0                                          256 5        ActiveStore
17      100.83.0.0/16                                  0.0.0.0                                          256 5        ActiveStore
...
You should be looking for your specific subnet's IP ranges (10.123.45.0/24 in case of int-net1) and anything from
100.*.0.0/16 range.
Some other alternatives are route print & Get-NetIPConfiguration.
Verifying routing configuration on the MacOS operating system
The easiest way to verify system configuration is netstat -nr command:
% netstat -nr

Routing tables

Internet:
Destination        Gateway            Flags               Netif Expire
...
100.83/16          utun100            USc               utun100
100.83.19.63       100.83.19.63       UH                utun100
...
10.123.45          utun100            USc               utun100
...

Internet6:
Destination                             Gateway                                 Flags               Netif Expire
...
You should be looking for utun* interface in 4th column and searching the rows for
your specific subnet's clamped IP ranges (10.123.45 in case of int-net1) and anything from 100.*/16 range.
Verifying routing configuration on the Linux operating system
Depending on specifics of your Linux distribution (or even your configuration of it) you should be able to use either
iproute2 or net-tools family of network commands.
openZro client stores it's custom routes in the routing table 7120 (or 0x1BD0) when it's available (through
iproute2 interface).
For iproute2 (ip, ss tools):
ip routeto find built-in100.*.0.0/16route,ip route show table 7120orip route show table allto find the specific routed networks,
For net-tools (ifconfig, route, netstat tools):
route -nto find built-in100.*.0.0/16route,- neither
routenornetstatsupport viewing content of custom routing tables,